Mastering the MeteorGIS Shapes Options
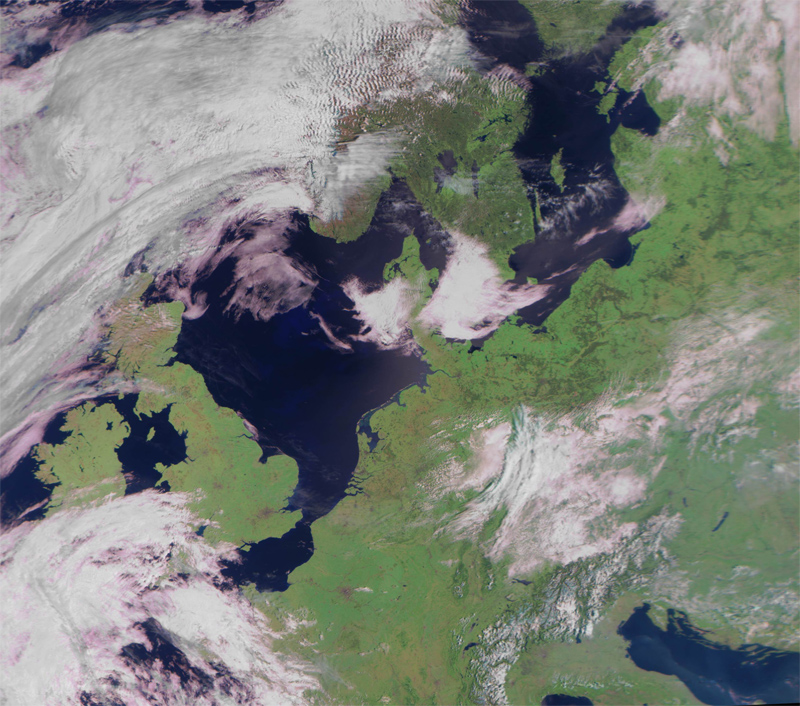
One of the most important features of MeteorGIS is the software's ability not only to reproject images from the Russian Meteor satellites, but also to add overlays consisting of Coastlines, country outlines etc. The two images below illustrate this.
 |
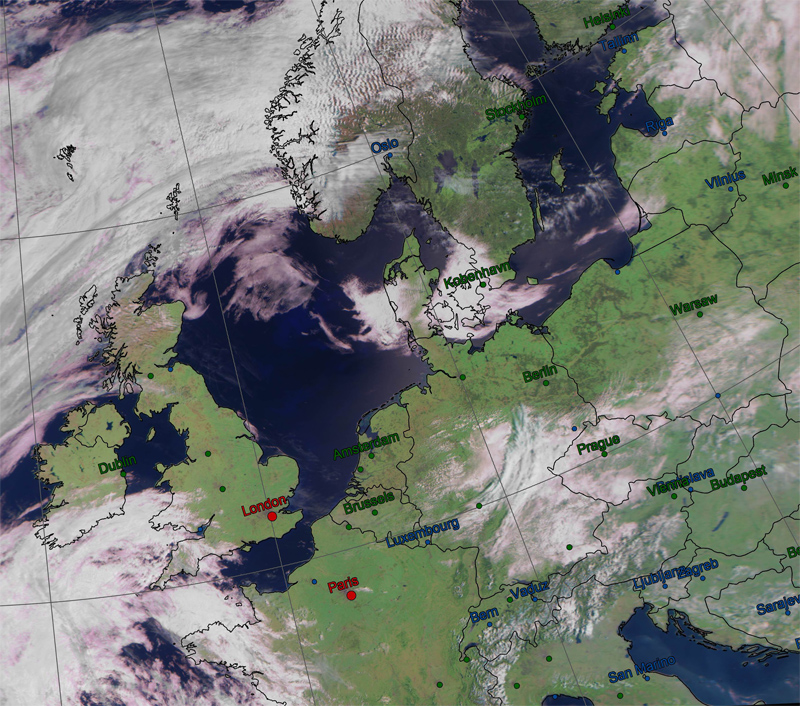 |
| Image from Meteor M2 on June 10, 2015 - Click either image to view a larger version | |
MeteorGIS calls these overlays Shapes.
What shapes are available in MeteorGIS?
|
MeteorGIS comes with five different Shapes options: 1. Coastlines which draws outlines of the Earth's major land masses and islands.
|
You can exercise control over all these features by editing lines in the default.ini file inside the MeteorGIS subfolder. A skeleton outline of these lines, which are found at the end of the ini file, is as below:
[Shapes]
...
[Shape0]
...
[Shape1]
...
[Shape2]
...
[Shape3]
...
[Shape4]
...
Editing the Shapes Parameters
Unlike many of the options in the default.ini file, which can be modified by means of the MeteorGIS_Configurator.exe provided within the MeteorGIS subfolder, the parameters associated with the Shapes section can not be edited in this way.
Instead, you have to load your default.ini file into a suitable text processing application and edit them manually.
I use Windows Notepad for this purpose.
[Shapes]
This is the opening section of the entire Shapes section of the ini file.
It takes a single parameter, shapesNumber=n, where n is the number of different shapes you wish to appear on your Meteor images.
shapesNumber=n determines how many of the shapes you wish to display, as follows:
n = 0: no overlays
n = 1: coastlines only
n = 2: coastlines + country boundaries
n = 3: All the above + a latitude/longitude graticule
n = 4: All the above + major cities
n = 5: All the above + major elevation points
[Shapes] is the ONLY parameter that can be edited using the MeteorGIS_Configurator.exe utility.
Load "default.ini" into the Configurator and open its Shapes tab. This contains a slider control which allows you to determine how many of the Shapes you wish to display on your images. Adjust as desired and save.
[Shape0]
Perversley, the author has numbered his shapes 0 to 4 rather than the more intuitive 1 to 5.
Shape0 is the shape that adds coastlines when ShapesNumber = 1 (not zero).
| Parameter | Purpose |
|---|---|
| filename=ne_10m_coastline.shp | This is the coastline data file |
| color=000000 | Colour of the coastline (000000=black) |
| thickness=2 | Thickness of the drawn outline |
You can edit the color and thickness attributes as you wish.
Note that the American spelling "color" is used throughout MeteorGIS. Do not change this to "colour" because, if you do, MeteorGIS will not recognise it.
Colours
A word here about colour selection is appropriate, as it relates to all five Shapes.
Colours are always denoted in hexadecimal format RRGGBB (the red, blue and green components of the colour).
| Hex code | Colour | |
|---|---|---|
| 000000 | Black | |
| FFFFFF | White | |
| FF0000 | Red | |
| 00FF00 | Green | |
| 0000FF | Blue | |
| FFFF00 | Yellow | |
| 00FFFF | Cyan | |
| 808080 | light Grey | |
| 404040 | dark Grey |
You can edit the color and thickness attributes to suit your preferences.
[Shape1]
Shape1 is the shape that adds Country Borders when ShapesNumber = 2 (not one).
| Parameter | Purpose |
|---|---|
| filename=ne_50m_admin_0_boundary_lines_land.shp | This is the country boundary data file |
| color=808080 | Colour of the coastline (808080=grey) |
| thickness=2 | Thickness of the drawn outlines |
You can edit the color and thickness attributes to suit your preferences.
[Shape2]
Shape2 is the shape that adds a Latitude/Longitude Graticule when ShapesNumber = 3 (not two).
| Parameter | Purpose |
|---|---|
| filename=ne_110m_graticules_10.shp | This is the Graticule data file |
| color=808080 | Colour of the graticule (808080=grey) |
| thickness=2 | Thickness of the drawn lines |
You can edit the color and thickness attributes to suit your preferences.
 [Shape3] - for European Capital Cities
Shape3 is the shape that adds Populated Places (Major Cities) to Meteor images when ShapesNumber = 4 (not three).
| Parameter | Purpose |
|---|---|
| filename=ne_50m_populated_places.shp | This is the Populated Places data file |
| form=circle | Shows location as a circle (or 'triangle' instead of 'circle') |
| thickness=2 | Thickness of the drawn lines |
| latitudeField=LATITUDE,N,19,11 | Do not change this |
| longitudeField=LONGITUDE,N,19,11 | Do not change this |
| rupturesField=POP_MAX,N,9,0 (i.e. Categories) | Do not change this |
| ruptures=500000,1000000,5000000 | Cities of over ˝ million, 5 million and 10 million people |
| colors=004590,006000,BF0000 | Colours of the three categories |
| sizes=15,18,21 | Sizes of the three city markers |
| fontSize=48 | Size of the font showing the city name |
| nameField=NAMEASCII,C,100 | Do not change this |
| drawName=fromfield | Do not change this |
| fromField=FEATURECLA,C,50 | Do not change this |
| contain=Admin-0 capital | Do not change this |
| containType=strict | Do not change this |
The "Do not change" parameters
All parameters categorised as Do not change automatically use data stored in the ne_50m_populated_places.shp file.
They do not have alternatives, so leave these well alone.
You can edit the form, thickness, ruptures, colors, sizes and , fontSize attributes to suit your preferences.
[Shape3] - for North American State Capital Cities
The parameters below are recommended for North Americal users (changes are highlighted in blue).
Shape3 is the shape that adds Populated Places (Major Cities and State Capitals) to Meteor images when ShapesNumber = 4 (not three).
Note: Because many State Capitals have much smaller populations than European Capital Cities, they are simply ignored.
The 'ruptures' limits have been lowered in this table, but can be adjusted as the user sees fit.
| Parameter | Purpose |
|---|---|
| filename=ne_50m_populated_places.shp | This is the Populated Places data file |
| form=circle | Shows location as a circle (or 'triangle' instead of 'circle') |
| thickness=2 | Thickness of the drawn lines |
| latitudeField=LATITUDE,N,19,11 | Do not change this |
| longitudeField=LONGITUDE,N,19,11 | Do not change this |
| rupturesField=POP_MAX,N,9,0 (i.e. Categories) | Do not change this |
| ruptures=50000,500000,1000000 | Cities of over 50000, 500000 and 1 million people |
| colors=004590,006000,BF0000 | Colours of the three categories |
| sizes=15,30,45 | Sizes of the three city markers |
| fontSize=48 | Size of the font showing the city name |
| nameField=NAMEASCII,C,20 | Do not change this |
| drawName=always | Do not change this |
| fromField=FEATURECLA,C,50 | Do not change this |
| contain=Admin-0 capital | Do not change this |
| containType=strict | Do not change this |
The "Do not change" parameters
All parameters categorised as Do not change automatically use data stored in the ne_50m_populated_places.shp file.
They do not have alternatives, so leave these well alone.
You can edit the form, thickness, ruptures, colors, sizes and , fontSize attributes to suit your preferences.
[Shape4]
Shape4 is the shape that adds Elevated Points (mainly mountains) to Meteor images when ShapesNumber = 5 (not four).
In my opinion this is a total waste of time, merely serving to add clutter to Meteor images.
A much more meaningful option is to delete the provided [Shape4] from default.ini and replace it with an option
to show Major Rivers instead.
Modifying [Shape4] to draw rivers on Meteor Images
This version of Shape4 adds rivers to Meteor images when ShapesNumber = 5 (not four).
Note that the MeteorGIS Suite does not contain the data files for drawing rivers.
These must be downloaded as the file Rivers.zip from the link below and added to your MeteorGIS application.
To implement, erase the entire [Shape4] section from the end of your default.ini file, then type the following in its place.
[Shape4]
; All but one of the following regions must be commented out
filename=ne_10m_rivers_europe.shp
; filename=ne_10m_rivers_north_america.shp
; filename=ne_10m_rivers_australia.shp
color=0000A0
thickness=3
| Parameter | Purpose |
|---|---|
| filename=ne_10m_rivers_europe.shp | Data file for major rivers of Europe |
| filename=ne_10m_rivers_north_america.shp | Data file for major rivers of North America |
| filename=ne_10m_rivers_australia.shp | Data file for major rivers of Australia |
| color=0000A0 | Colour of the rivers (0000A0=medium blue) |
| thickness=3 | Thickness of the rivers |
Notes
The shapefiles used by MeteorGIS come from https://www.naturalearthdata.com/downloads/ but have been modified to work correctly in MeteorGIS. As with other Shapes, the 'color' and 'thickness' parameters can be adjusted to your own preferences.
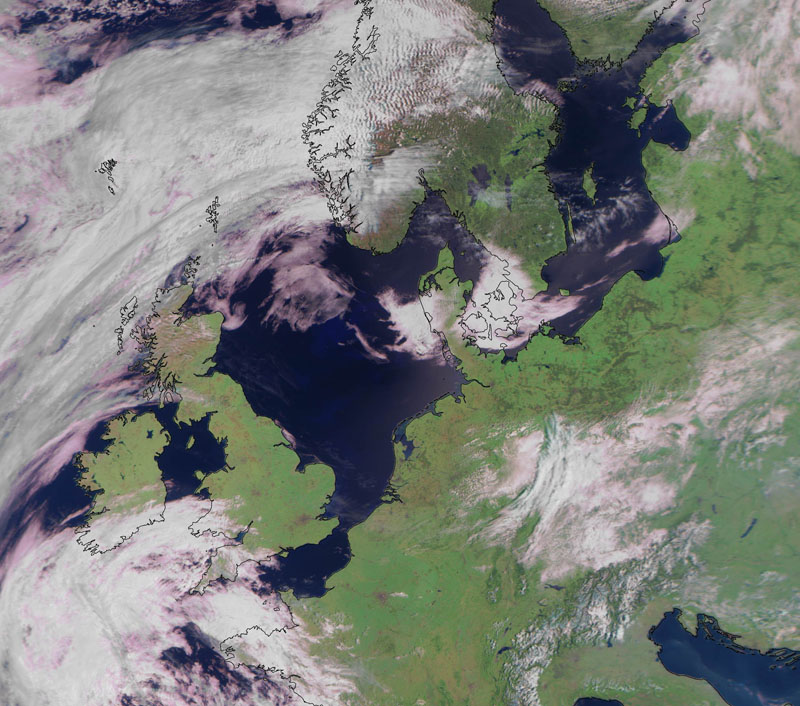
As shown above, the Europe Rivers will be displayed.
Not all river courses are complete: many have gaps in their courses.
This is a feature of the original files and was not caused by the Multipart to Singlepart process used to prepare them for MeteorGIS.
Note that the leading semi-colon comments out the files of North American and Australian rivers.
MeteorGIS can only handle one Rivers File at a time.
• If you are in North America, remove the semi-colon before filename=ne_10m_rivers_north_america.shp.
• If you are in Australia, remove the semi-colon before filename=ne_10m_rivers_australia.shp.
• In either case, make sure the semi-colon is present before the two other data filenames.
If you live in any other region of Earth, you are out of luck.
River data is only available for the three regions referenced above.
 |
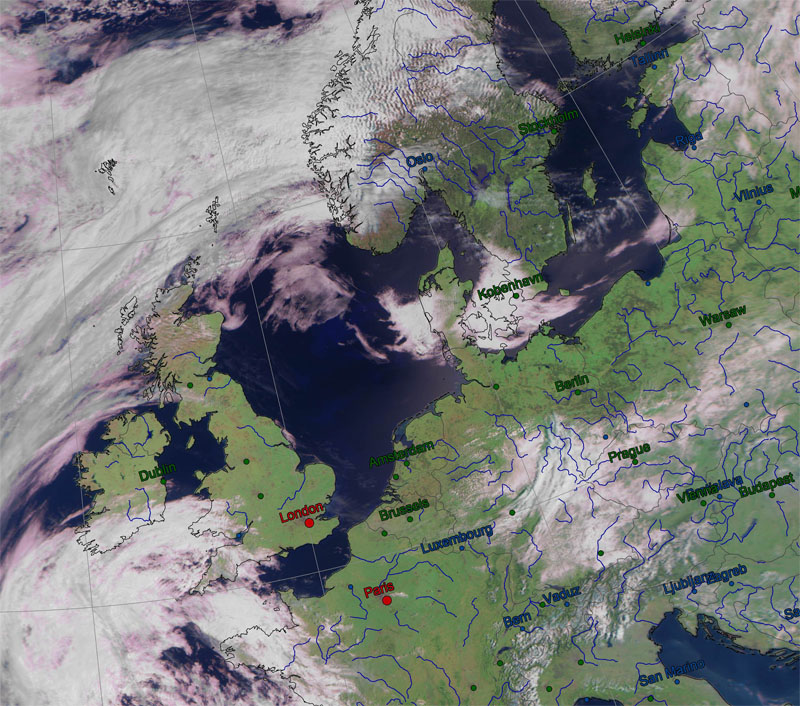 |
| Click either image to view a larger version. | |
Obtaining the modified Rivers data files
The necessary modified files of river data have been bundled into a zip file called rivers.zip.
To download 'rivers.zip'
Then extract them into the MeteorGIS subfolder on your PC alongside similar files for coastlines etc., and you are good to go.
This page has been accessed times.
Counter supplied by 
Please e-mail any queries to
This is NOT a link - you must type this address into your email application