Add Digitised Bracknell Charts to MeteorGIS Images
with a UK MetOffice Mean Sea Level Pressure (MSLP) Chart following a procedure developed by
Swiss Physicist and former teacher Ernst Lobsiger (click the image to see a full size version).
Though prepared by the Met Office, these MSLP charts are still widely referred to as "Bracknell Charts" because, prior
to 2003, the Met Office headquarters were located in Bracknell:
they are now located in Exeter.
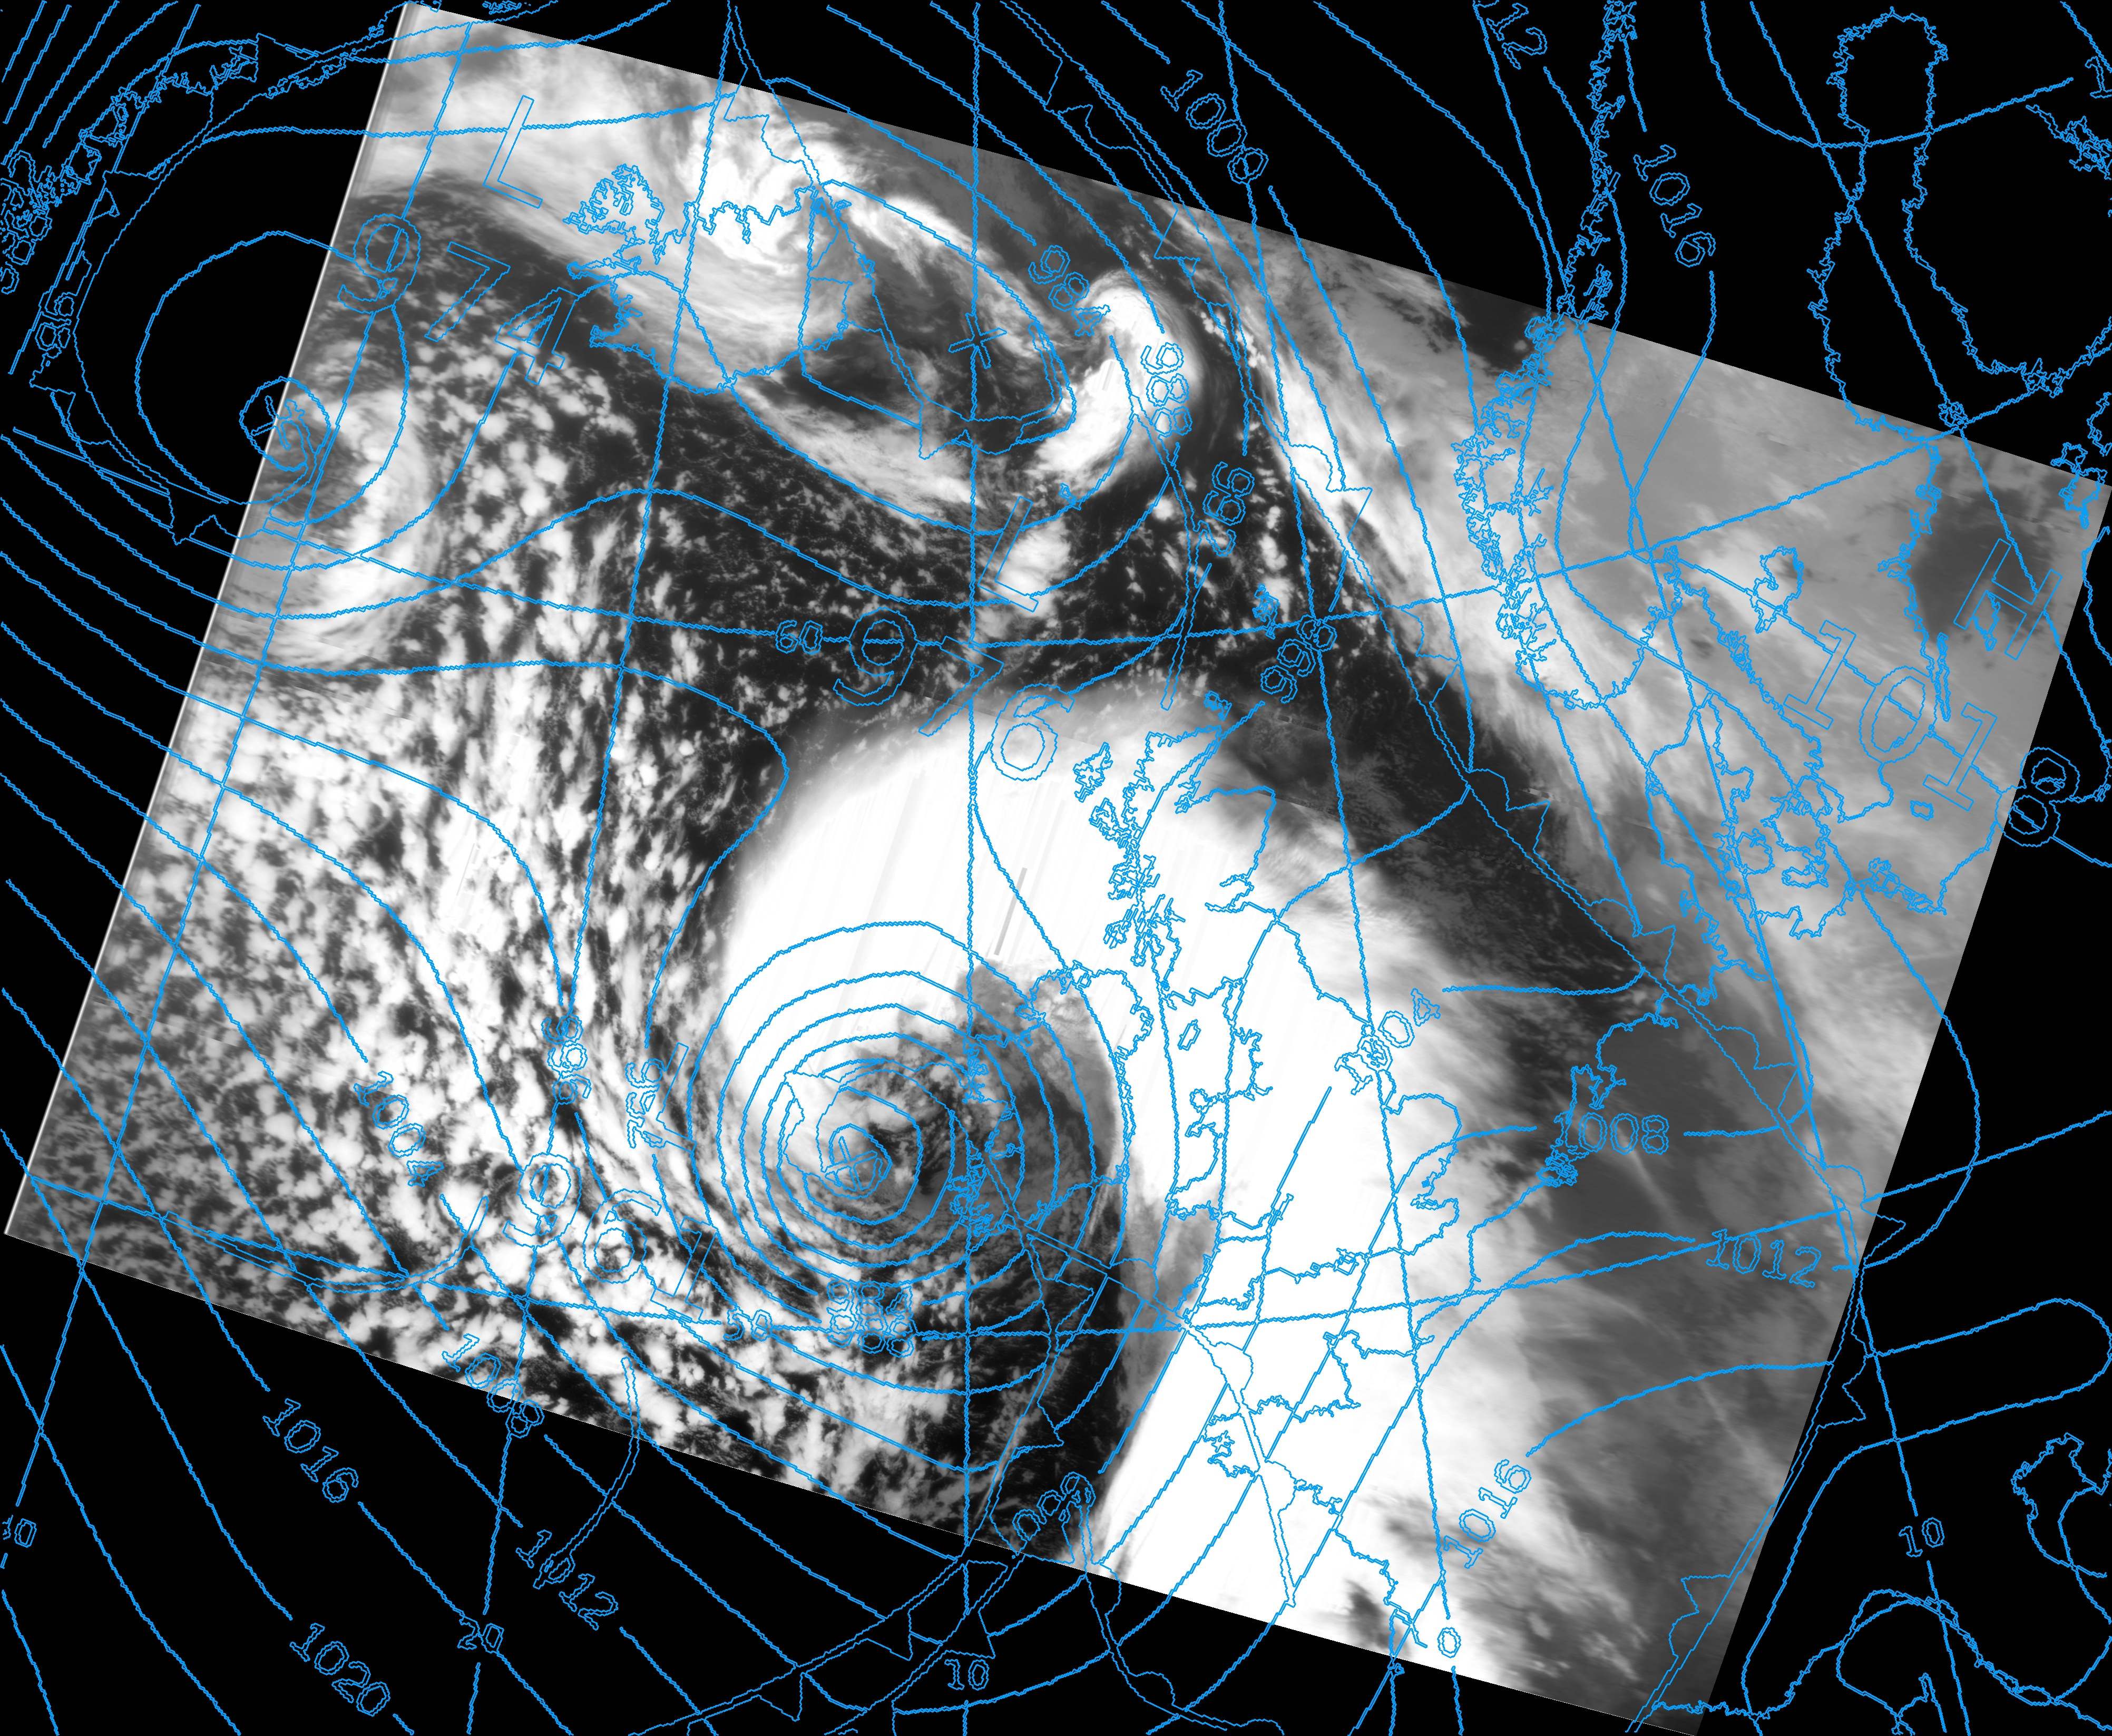
This composite above was created from the original infrared Meteor M2 image of Storm Barra and the
corresponding 0600 MSLP Bracknell chart, both illustrated below.
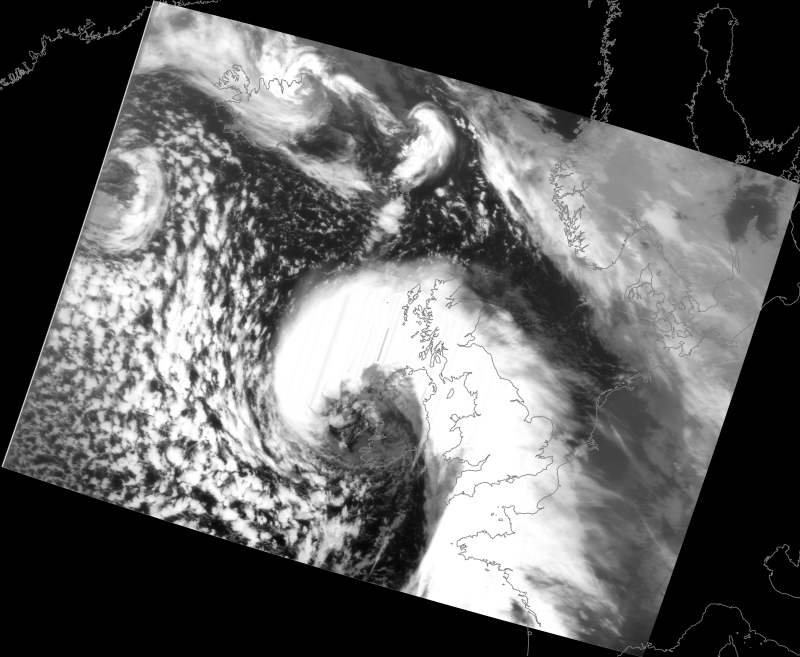
The Storm Barra MeteorGIS infrared image acquired at 0708 UTC on December 7, 2021.
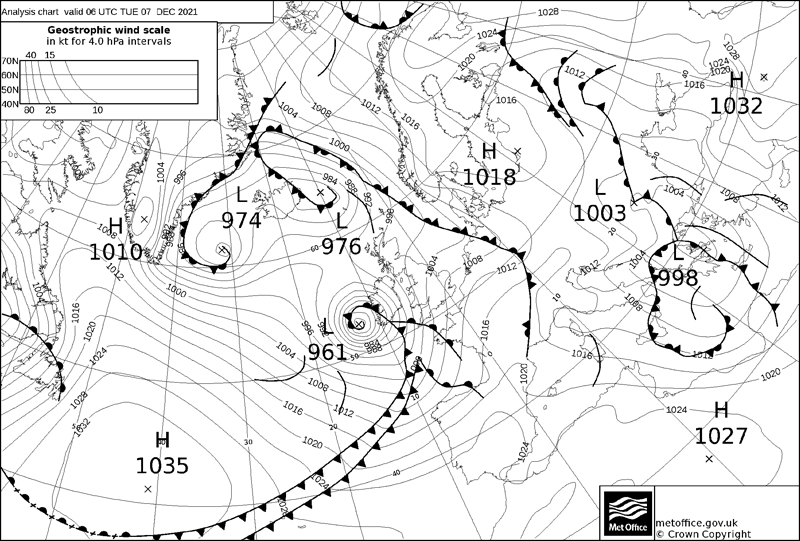
The 0600 UTC Bracknell Chart for December 7, 2021.
Shapefiles
If you have used the MeteorGIS system, you will be familiar with the fact that features such as coastlines, country outlines and cities can all be added accurately to MeteorGIS images. These minor miracles are achieved through the use of shapefiles, which are the digitised datafiles that you find within the MeteorGIS subfolder, with extensions .dbf, .shp and .shx.
By way of example, 50-metre coastlines are generated by the set of shapefiles named ne_50m_coastline.dbf, etc.
Creating shapefles for Bracknell charts was, of course, the problem. Coastlines etc. do not change significantly over time, but the weather does. The Bracknell Charts are updated every six hours and often exhibit significant changes within that six-hour timescale. This means that Bracknell Shapefiles have to be recalculated daily. What Ernst Lobsiger has achieved is a means of digitising high-definition Bracknell charts and converting them into shapefiles using Free and Open Source software in a procedure that take just a few minutes. These shapefiles can then be utilised by MeteorGIS.
QGIS - the Digitising Software
Key to the entire process is QGIS, a Free and Open Source professional GIS application.
Click the link below to download QGIS version 3.16.15-1 Long Term Release (Hannover).
https://qgis.org/downloads/QGIS-OSGeo4W-3.16.15-1.msi.
Important Note: If you browse the QGIS website you will find numerous versions of this software available for download.
It is vital that you download a version with the .msi filename extension and not one with the .exe extension. The version recommended above is rather hard to track down on the QGIS website and you should use the link above.
The .msi version is a download of 1.037 GB (as opposed to 300 MB for the .exe versions), and contains superior helper applications, specifically GDAL v 3.40, which is essential for the digitisation process.
When installation is complete you will be confronted with several new desktop shortcuts.
Select the shortcut labelled QGIS Desktop 3.16.15 to run the program.
Note: More recent versions of QGIS will almost certainly work too.
QGIS v 3.22.3-1.msi has been successfully trialled, and is available from the QGIS Download Page
If you plan to try a more recent version of QGIS, then be sure to download the gigabyte .msi version
Obtaining Bracknell Charts for QGIS
Before you can use QGIS, it is necessary to emplace a structure to both download and process the Bracknell charts.
Bracknell MSLP charts are provided as .gif images. For digitising in QGIS, they must be converted into a black and white 2-bit .png images.
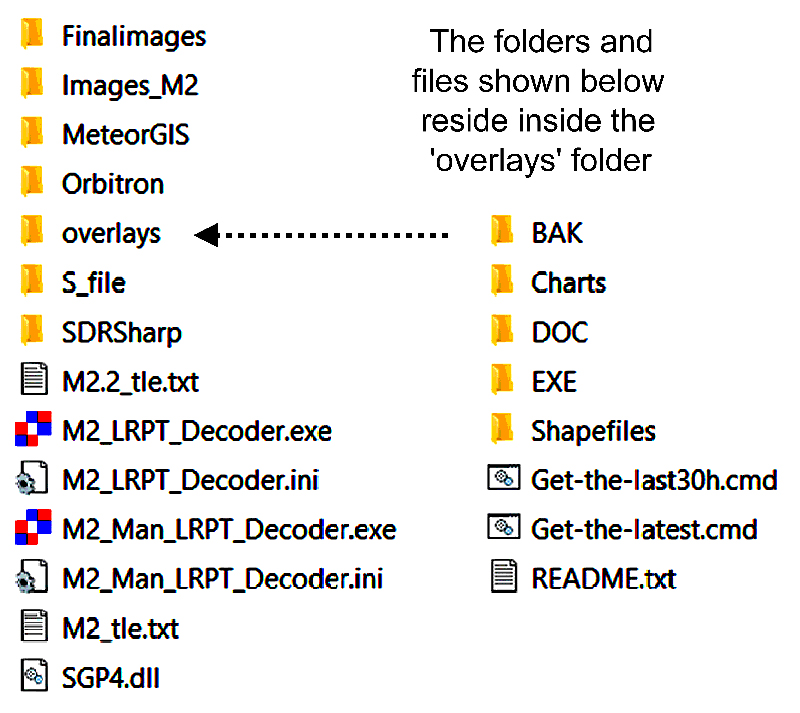
Ernst Lobsiger has automated the download and conversion process by providing the file ChartOverlaySetup.zip which should be unzipped inside the main MeteorGIS folder to add an additional folder: "Overlays".
Overlays contains five subfolders and two cmd scripts as illustrated opposite. The BAK and EXE folders contain essential files required in the preparation of the Bracknell.png images. Do not touch/change these files!
Charts is an empty folder where the processed Bracknall charts are automatically stored.
Shapefiles is another empty folder in which you should save the shapefiles ultimately created by QGIS.
DOC contains a PDF copy of Ernst Lobsiger's detailed document which, for those interested, provides illustrations and fine details of every step in the procedure.
The CMD Scripts
Double-clicking the Get-the-latest.cmd file downloads the most recent Bracknell chart, processes it as a .png image, and saves it in the Charts folder along with a 'World File' with the same filename but extension type .pngw. The 'World File' contains coordinate data required to digitise the chart in QGIS and create the shapefiles.
Typical filenames for a Bracknell chart and its related World File are as below:
| Bracknell-202201110600.png |
| Bracknell-202201110600.pngw |
Bracknell charts are issued at 6-hourly intervals daily: at midnight, 0600 UTC, 1200 UTC and 1800 UTC. They can be downloaded from www.weathercharts.org who retain a small archive consisting of the most recent 30 hours of high-resolution Bracknell Charts. If you have missed a chart within the previous 30 hours (or prefer to download a 30-hour supply of charts in bulk at the end of a day), the Get-the-last30h.cmd file does just that, again depositing each chart, with its 'World File', in the Charts folder.
If you are interested, you can view the available high-resolution charts, and download the .gif versions, from https://www.weathercharts.org/ukmomslp_max.htm.
Download the ChartOverlaySetup File by clicking the link below
Once you have downloaded the ChartOverlaySetup.zip file, extract its contents into the main MeteorGIS folder.
Configuring QGIS for the Bracknell Charts
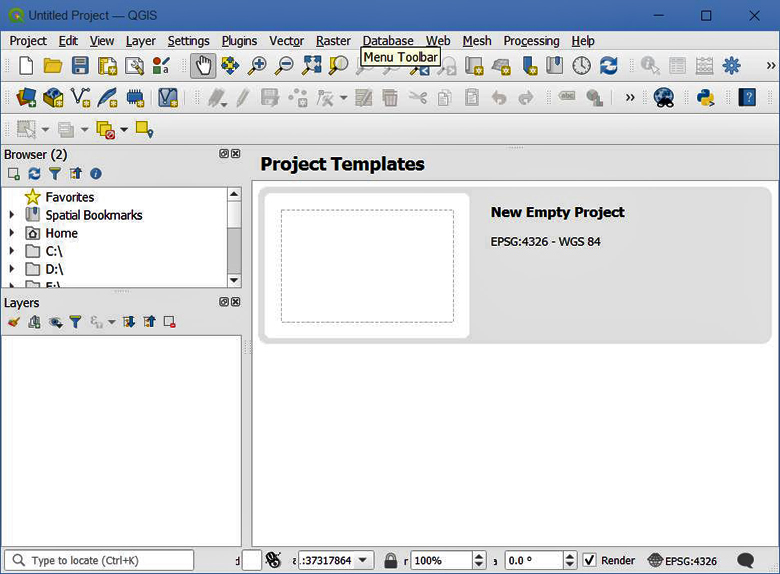
When newly installed, QGIS displays a number of advertising/information panels on its opening screen.
Delete all these until you are left only with the New Empty Project template.
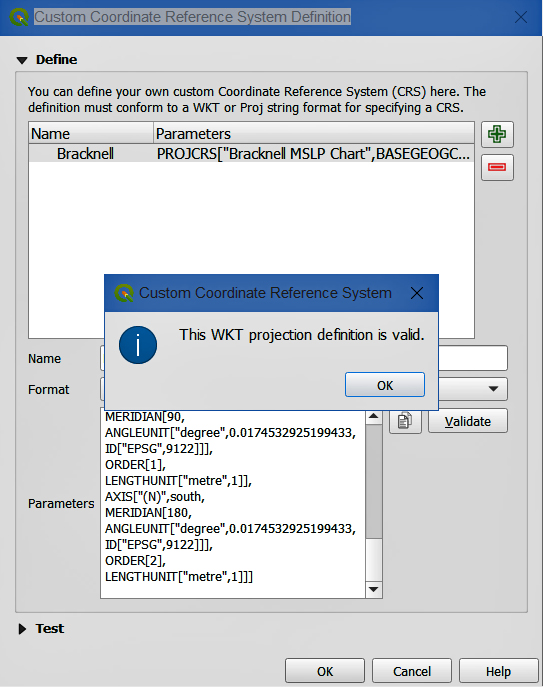
Once QGIS is installed, you have to define a user Coordinate Reference System (CRS) using the definition in the panel opposite. This WKT string has been copied from a GEO-tif output of PyTROLL/Satpy. Open QGIS and click over the New Empty Project panel to select it (if you don't. QGIS won't be able to save your new Bracknell CRS definition). In the main Menu Bar, select 'Settings/Custom Projections...', click the plus sign at upper right and rename new CRS in the 'filename field' to Bracknell. You must now copy the WKT string. There are several ways to do this:
Make sure that the Format selector shows WKT then click over the lower Parameters window and paste the definition string there by pressing control-V. Now press Validate. If the WKT is accepted as valid, click OK to save the Bracknell definition. QGIS is now ready for use in digitising Bracknell charts and you do not have to repeat the above procedure again.
|
PROJCRS["Bracknell MSLP Chart", |
Digitising a Bracknell Chart with QGIS
First, go into the MeteorGIS/overlays folder and double-click the Get-the-latest.cmd file.
This will upload the latest Bracknell.gif chart and convert it into the Bracknell.png version needed by QGIS for digitising. At the same time, it will create the accompanying Bracknell.pngw World File.
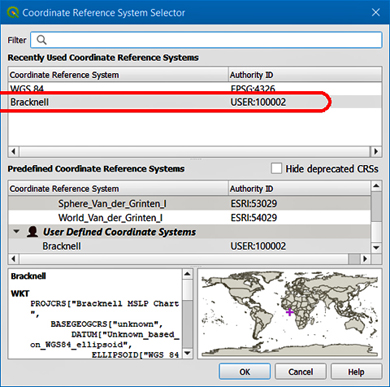
Now click Project/Properies on the QGIS Menubar and, on the screen that follows, click the CRS button in the left-hand panel to open the window illustrated below. Enter Bracknell in the filter line and you should find Bracknell listed under User Defined Coordinate System, as shown.
If this is the case, you are ready to start processing Bracknell MSLP Charts
Note: What follows is a quick run-through of all the steps required to create shapefiles. A much fuller explanation is provided in Ernst Lobsiger's PDF document "The Bracknell Chart Revisited" which you will find in the MeteorGIS/overlays/DOC folder.
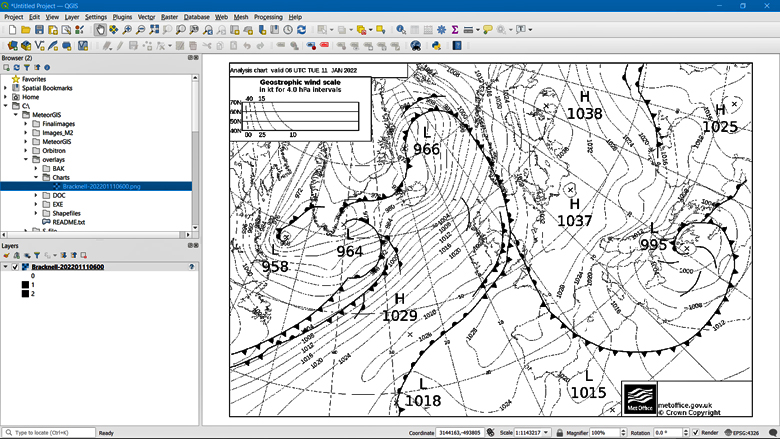
The QGIS screen in front of you should look like the illustration below, with two important panels, Browser (2) and Layers at the left hand side. If they have not appeared automatically, right-click on the Menubar and select them from the drop-down menu.
The main window should show a Project Template entitled New Empty Project,
Now go to the Browser (2) panel, navigate to the MeteorGIS/overlays/Charts folder and double-click on a Bracknell.png image.
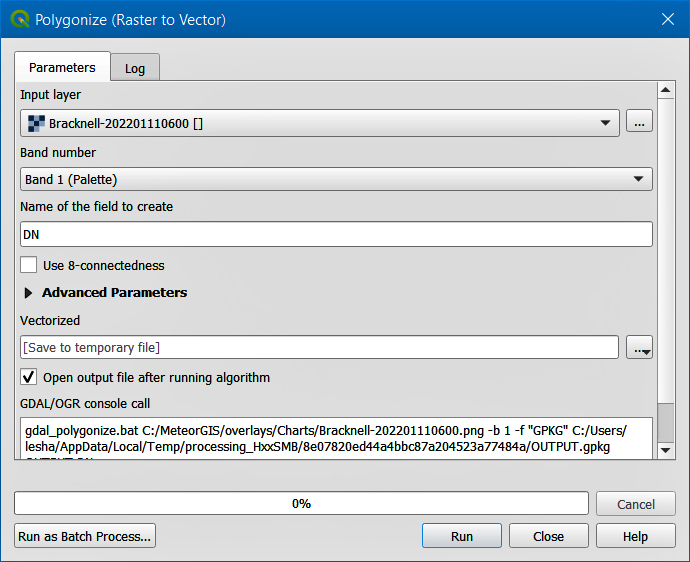
The first step in converting this into a digitised Bracknell Chart is to select Raster/Conversion/Polygonize (Raster to Vector) from the main menubar, when the panel below appears. Just accept the default settings and press the Run button.
Select Vector/Geometry Tools/Polygons to Lines from the main menubar. Again, don't alter the default settings. Just click the Run button. This conversion completes in just a couple of seconds. Press the Close button and move on to step 4.
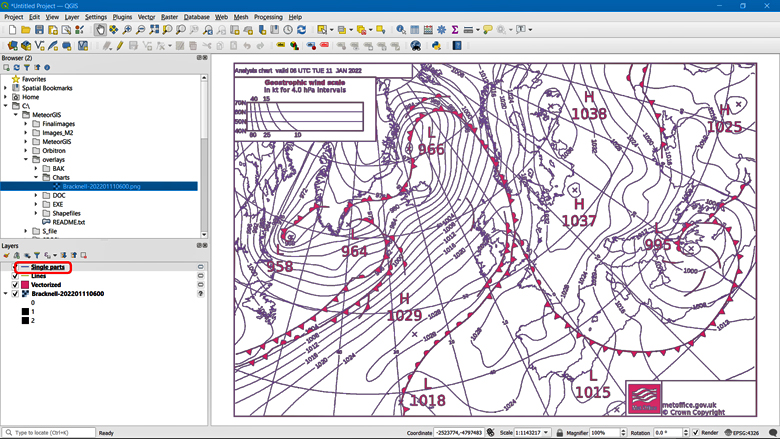
Select Vector/Geometry Tools/Multipart to Singleparts from the main menubar. Click the Run button, followed by the Close button when the conversion is complete. Your screen should look like the illustration below.
Now move on to step 5.
On the screen above, right-click on Single Parts in the Layers Panel, highlighted by a red rectangle.
Click on Bracknell followed by the OK button to move on to Step 6.
Select Vector/Data Management Tools/Reproject Layer from the main menubar.
Select Layer/Save As from the main menubar to reveal the panel illustrated below, left.
Make sure that the Format field shows ESRI Shapefile
To the right of the Filename field is a small Button outlined in red in Figure 1.
Click OK at the foot of the panel and your shapefiles will be saved in the Shapefiles folder.
NOTE: Provided you don't type anything in the File name field, next time you click the button it should take you straight to this 'remembered' folder address. You then need only type 'Bracknell' in the browser window's Filename field to continue as before (i.e. no longer any need to navigate to the Shapefiles folder).
Inside the MeteorGIS subfolder is the file default.ini which is used by MeteorGIS to determine which parameters to use when processing images: these includes shapefiles for coastlines, country outlines, graticule and cities as well as details of their colour representations and line thicknesses.
Also present within the MeteorGIS subfolder is a batch file named default.bat which allows the user to reprocess a Meteor image using the information in default.ini at a later time. The code within the batch file is
MeteorGIS.exe /nolive /composeauto /sat:M2 /config:default.ini
I don't add a Bracknell overlay to every Meteor image: only to those images that display particularly interesting weather/cloud features, such as Storm Barra, illustrated at the head of this page. What is needed are separate Bracknell.bat and Bracknell.ini files that can be utilised specifically when such a need arises, as explained below.
1. Make a copy of default.bat and rename it Bracknell.bat
2. Edit the contents by replacing 'default' by 'Bracknell', thus
MeteorGIS.exe /nolive /composeauto /sat:M2 /config:Bracknell.ini
3. Make a copy of default.ini and rename it Bracknell.ini
4. Edit Bracknell.ini in Notepad or a similar text editor. Only two items need be altered, shapesNumber and filename.
5. Be sure to save Bracknell.ini when editing is complete.
Depending on taste, you can also edit the thickness value to make the lines on the chart thinner or thicker.
Make sure that the Bracknell.bat and Bracknell.ini files both reside inside the MeteorGIS subfolder, with the other .bat and .ini files, and you are ready to go!
If you are uncertain about making these edits, you can download the edited versions in a zipfile HERE
After your Meteor image has been acquired, download the Bracknell chart closest to it in time and prepare the shapefiles.
Make sure that the FinalImages Folder inside MeteorGIS is emptied of files (because MeteorGIS never overwrites existing files) then double-click on the Bracknell.bat file to run it. You will see MeteorGIS run through its processing routine, finishing off with the rendering of the Bracknell shapefile. The image will be saved into the FinalImages Folder.
Note that the application of a Bracknell overlay works equally well for both UTM and Mercator projections.
When I first started following Ernst Lobsiger's 'recipe' for creating Bracknell Chart shapefiles, it seemed to take an age, referring back and forth through his lengthy document which, though detailing all the key QGIS operations, intersperses them with detailed discussion and screenshots of each stage. So I prepared a written reference list of all the key operations and, after a few days, once I had memorised them, realised that it actually only took about two minutes to complete the process. Below is a 'cheat sheet' as an aid to speeding up the learning process.
The following assumes that you have already installed QGIS, successfully defined the Bracknell Coordinate Reference System (CRS) from the WKT string, and downloaded a Bracknell.png chart and Bracknell.pngw world file into the 'Charts' subfolder.
Look back to the Storm Barra image at the top of this page.
In most respects it looks good, with country outlines, graticule and isobars accurately drawn.
In case you have found the instructions above daunting, I have prepared a short (5 minutes) YouTube video that shows the following processes taking place in real time to illustrate just how efficient the process is once memorised.
1. Downloading and preparing the Bracknell chart using Ernst's script, Get-the-latest.cmd, in the overlays folder.
This page has been accessed Please e-mail any queries to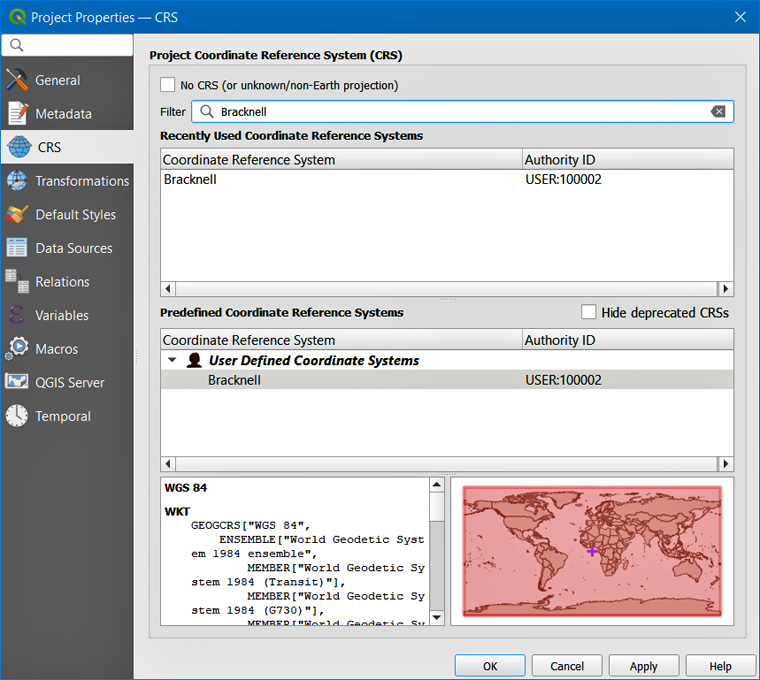
Creating Shapefiles with QGIS
Step 1: Load a Bracknell Chart
You should now see the Bracknell chart displayed in the right-hand pane as a raster layer (illustrated below).
Step 2: Raster to Vector
This is the most time consuming of all the conversion procedures, and on my PC takes almost 30 seconds!
QGIS reports when the process is complete, and you can then press the Close button and move on to step 3.
Step 3: Polygons to Lines
Step 4: Multipart to Singleparts
Step 5: Set Layer CRS
From the menu that appears, select Layer CRS/Set Layer CRS to open the Coordinate Reference System Selector panel, shown below highlighted by a red rectangle (If you don't immediately see 'Bracknell', type it in the Filter field).
Step 6: Reprojection
Check that the default Target CRS is set to EPSG:4326 - WGS84.
Click the Run button followed by the Close button and move on to Step 7.
Step 7: Save the Shapefiles
Click this button and use the browser window that pops up to navigate to the MeteorGIS/overlays/Shapefiles folder.
Type Bracknell into the Filename field then click Save to confirm your selection.
You will now find that the full filename path is displayed in Figure 2.
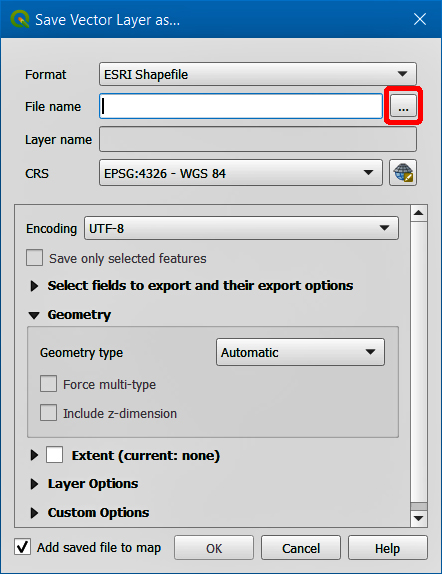
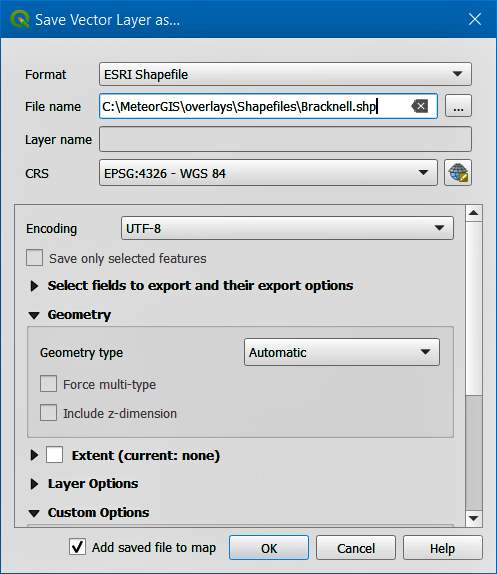
Figure 1 Figure 2
Creating a Batch File to add Bracknell Shapefiles to Meteor Images
Old code Edited code
[Shapes]
shapesNumber=3
[Shape0]
filename=ne_10m_coastline.shp
color=#404040
thickness=4[Shapes]
shapesNumber=1
[Shape0]
filename=../overlays/Shapefiles/Bracknell.shp
color=#404040
thickness=4
The color value can also be edited. If you want to change the colour, consult the link below for values.
Just unzip the contents into your MeteorGIS subfolder.Creating Meteor Images with Bracknel Overlays
Cheat Sheet for preparing Shapefiles
1 In the Browser(2) panel, navigate to the 'Charts' subfolder and double-click to load a Bracknell chart 2 Select “Raster/Conversion/Polygonize (Raster to Vector)" from the main menu and click Run. This takes about 30 seconds. When complete, click the Close.button. 3 Select “Vector/Geometry Tools/Polygons to Lines” from the main menu and click Run. On completion click the Close.button. 4 Select “Vector/Geometry Tools/Multipart to Singleparts" from the main menu and click Run. On completion click the Close button. 5 Go to the “Layers” panel and right-click Single parts. In the ensuing menu, select “Layer CRS/Set Layer CRS".
In the “Coordinate Reference System Selector” that opens, click “Bracknell” then OK.6 Select “Vector/Data Management Tools/Reproject Layer" from the main menu. Click Run, click Close. 7 Press “Layer/Save As”, click the button, type in 'Bracknell' etc., as explained in more detail earlier.
Taking a Closer Look
But the weather fronts and their triangular and semicircular symbols are shown only in outline!
This is because the MeteorGIS.exe software has not been designed to render solid shapes, and only understands point and line segment data.
YouTube Video
2. Digitising the chart and creating the shapefiles using QGIS.
3. Running the Bracknell.bat file in the MeteorGIS subfolder to process a Meteor M2 image and apply the Bracknell shapefiles.
4. Display the resulting Meteor image with MSLP data overlain upon it.
times.
Counter supplied by 


This is NOT a link - you must type this address into your email application