
A Guide to Processing A.P.T. Weather Satellite Images
Using David Taylor's SatSignal software
There are a number of excellent programs available for capturing the raw APT signals from NOAA polar orbiting weather satellites.
Some of these also display images and offer an array of useful image processing options.
However, it is generally recognised that if you wish to achieve the very best possible images from your WAV files, you require software dedicated to this task alone.
David Taylor's SatSignal was specifically developed for this purpose, and has no peer in this arena. The guide below explains the main features of the software.
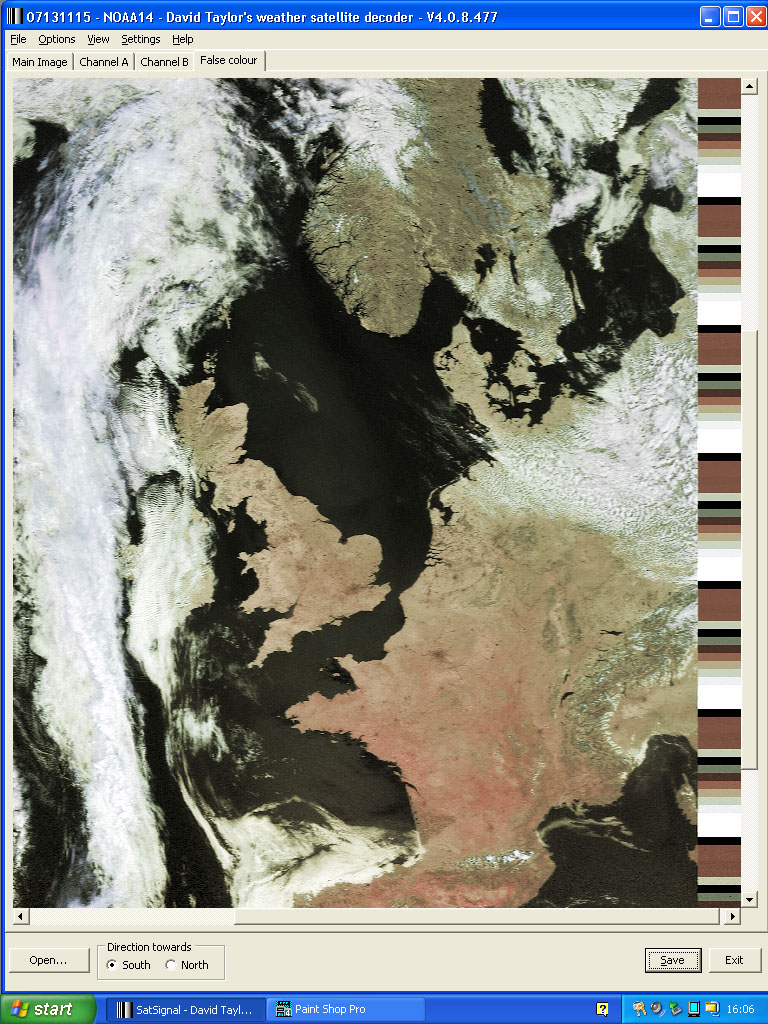
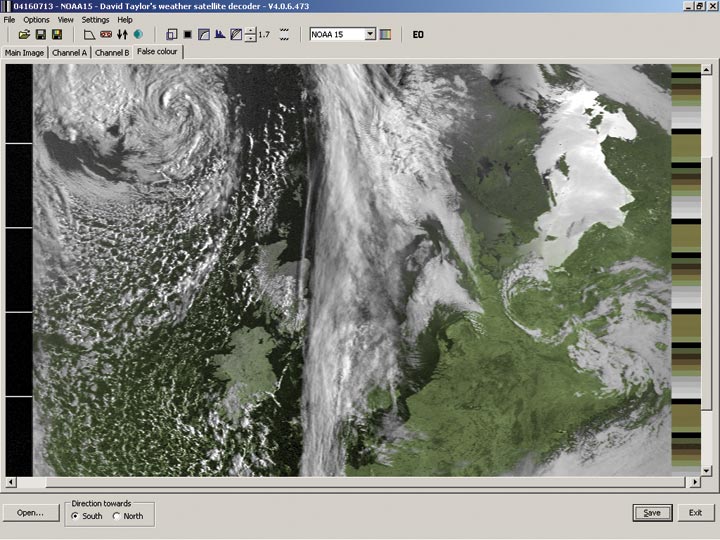
This colour image was produced using a newly installed, unregistered copy of SatSignal, under the program’s default settings. What you see is a screen dump of the Satsignal window as it appears in Windows XP™, using a vertical screen. Details: NOAA-17 at 11:15 UT on July 13, 2003.
Click on the image at right to see a larger version
Installing SatSignal
To install SatSignal you require two items of software, the Satsignal archive (satsignal4nn.zip) and the run-time library bundle (runtimes-setup-100.zip). Both are available from David Taylor’s website:
http://www.satsignal.eu –> Satellite Tools –> SatSignal
Open the runtime bundle and double-click on the file runtimes-setup.exe to install it. Next, create a new folder on your computer called ‘Satsignal’ then open the satsignal4nn.zip file and extract all its files into this folder.
Finally, for convenience, create a Desktop shortcut by dragging the satsignal.exe icon from this folder on to your PC Desktop using the right-hand mouse button and clicking ‘Create shortcut here’.
Image Processing with SatSignal (unregistered version)
Unlike some other software packages, where results can depend critically on the hardware you use (specifically your wx-receiver output level and the type of soundcard), Satsignal takes much of the hassle out of APT image processing by fully analysing each WAV file prior to decoding, and optimising basic decoding parameters before creating images. As a result, performance is not hardware-related and anyone following the methods outlined below should obtain top quality images.
Satsignal simultaneously decodes each WAV file into four separate images which can be viewed on the four tabs on the main Satsignal screen as shown below.
| • Main Image: | a raw image consisting of the channel-2 visible image and the channel-4 infrared image side by side |
| • Channel A: | a modified channel-2 image |
| • Channel B: | a modified channel-4 image |
| • False colour: | a colour composite image |
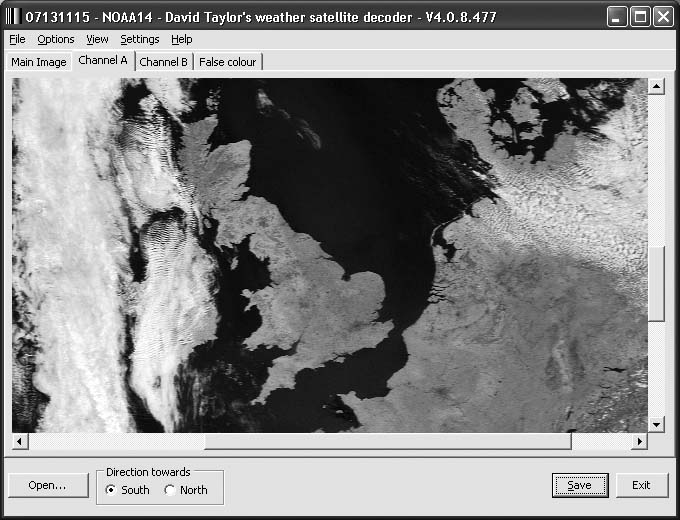
The channel A tab showing a visible light image
How to Decode a WAV File
In order to use Satsignal you must already have available a NOAA satellite WAV file that has been created using software
such as Wxsat, WXtoImg, Recall or APTDecoder. Start by loading this file into Satsignal by
clicking Double-click on the entry for this WAV file to initiate processing (for your first attempt, try to choose a good
overhead pass without any interference).
The WAV files from weather satellite APT are always created with a nominal sample-rate of 11025 Hz. If Satsignal finds
this to be accurate, processing starts immediately. However, if you are using a slow, older computer, the sample-rate
may differ slightly from this figure (even a 5 Hz deviation will make the decoded images slant), and Satsignal will
recommend a revised value; if this is in the range 11,010 to 11,040Hz, accept it. If the value suggested by SatSignal is
outside this range, it is likely that there is something wrong with the wave file or, less likely, with your soundcard.
If this still fails to provide straight (i.e. vertically aligned) images, use the Decoding is highly processor-intensive and the time taken to produce your images depends crucially on the specification
of your computer. The table below lists the processing times for the same WAV file on a variety of computers.
On a very basic 233 MHz Pentium-1 laptop with 32 Mb RAM, image processing took (nearly) forever—just four seconds
less than ten minutes to complete the task. Increasing the available RAM has a dramatic effect; 192 Mb reduced processing
time by a factor of more than twenty, still with a very modest processor.
So the message is clear—the more RAM you have the better. Faster processors help too, but their effect is much less
significant. Low specification computers can take a very long time indeed, and a minimum 64 Mb of RAM is recommended.
In line with their primary objective of helping to analyse our planet’s weather, NOAA satellites have been designed
mainly to image Earth’s cloud cover. Clouds reflect brightly in sunlight, but land and sea surfaces have a low albedo
(reflectivity). This means that while cloud rendition is excellent, land regions frequently show up very poorly by
comparison. Two tools, 'Equalise histogram' and 'Gamma correct' will frequently help to produce more pleasing results.
The default, which gives good results for well-illuminated summertime passes is 1.3. In an image where the land is
particularly dark and featureless try increasing the gamma. From the menu-bar click Note how Scandinavia in particular benefits as the gamma is progressively increased. On the other hand, cloud
definition over the Atlantic Ocean deteriorates.
When the same range of gamma adjustments is made to the Channel-4 infrared image (below), land detail is
progressively enhanced while definition in the bright clouds suffers.
Choose the gamma setting that meets your requirements best.
This useful tool is found in the <Options –> Equalise histogram> menu.
Histogram equalisation redistributes the greyscale intensities over the image so that each of the 256 levels in the
image is distributed evenly across the brightness range. This does not generally make much impact with well-illuminated
visible light images, but often results in a startling improvement in infrared images. The images below illustrates the
effects of histogram equalisation, at the default gamma setting of 1.3.
The right-hand image in each pair has been equalised: Channel-2 (left pair) and Channel-4 (right pair)
Histogram equalisation may also prove advantageous when preparing images from morning satellite passes when the sun
is low in the sky and illumination is uneven. The 8 images below show just this situation with an early-morning NOAA-15
pass obtained in April: the sun is still low in the eastern sky and the right-hand side of the image is much more strongly
illuminated than the left.
The upper row of images shows the effects of gamma correction alone, which tends to result in rather
'flat' images with a restricted range of tones. Application of histogram equalisation to each is shown in the lower
rank of images. The actual choice of parameters will be dictated by the particular part of the image that you are trying
to enhance.
Registering Satsignal presents many worthwhile new options, some of which are discussed below.
One of the most useful is the Illumination adjust feature which compensates in a much more effective manner for the
lateral lighting imbalance present in images like those above. The image below shows just how much detail can be preserved
using this option. While cloud over the Atlantic is now nicely rendered, the subtle light variations over the Baltic Sea
are retained—altogether a much more satisfying result than previously.
If you look carefully at this image you will also note the presence of a toolbar above it. This greatly simplifies
the use of the program by providing one-click pathways to many of the most common options.
While the free version of SatSignal offers just a single colour scheme, registration opens the door for the use of
several predefined palettes and also allows you to create your own.
The left-hand image of the pair above employs a user-defined palette that adds blue to the sea surface; the right-hand
one uses the supplied 'temperature' palette. The two images also illustrate the addition of automatic captions, gridding
and country outlines to the images.
Processor MHz RAM (MB) Processing
Pentium I 233 32 9 min 56 sec Pentium II 366 192 27 sec Pentium III 500 256 19 sec Pentium IV 2800 1000 5 sec Optimising the Images
Gamma Correction
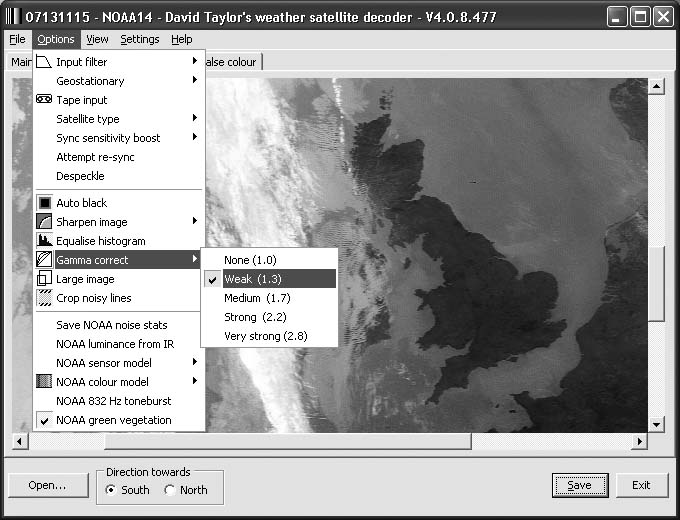
The channel B infrared image and the Gamma correct menu
Satellite APT produces images containing 256 grey-scale tones, ranging from black through a range of intermediate
greys to white. A typical NOAA image may emphasise the white and light greys (cloud), leaving the darker greys (land)
at a very low level. The gamma correction tool allows the intensities at the 'white' end of the spectrum to be reduced
while those at the 'black' end are enhanced. No image information is lost: intensities are simply redistributed so that
they produce a more aesthetically appealing result on the PC screen. Satsignal offers five levels of gamma correction
from zero to 2.8.
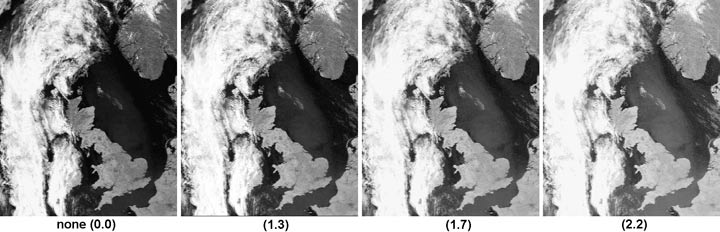
Gamma correction (channel-2 visible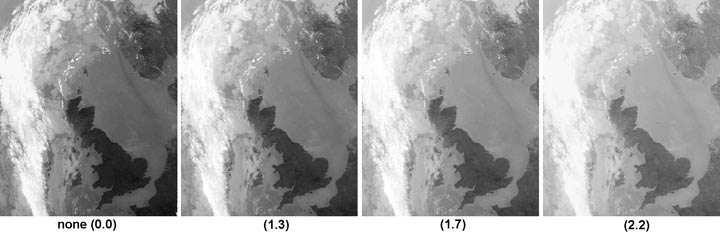
Gamma correction (channel-4 infraredHistogram Equalisation
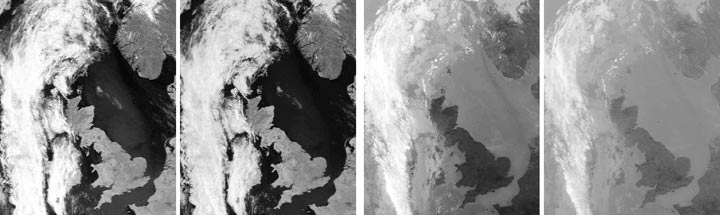
Histogram equalisation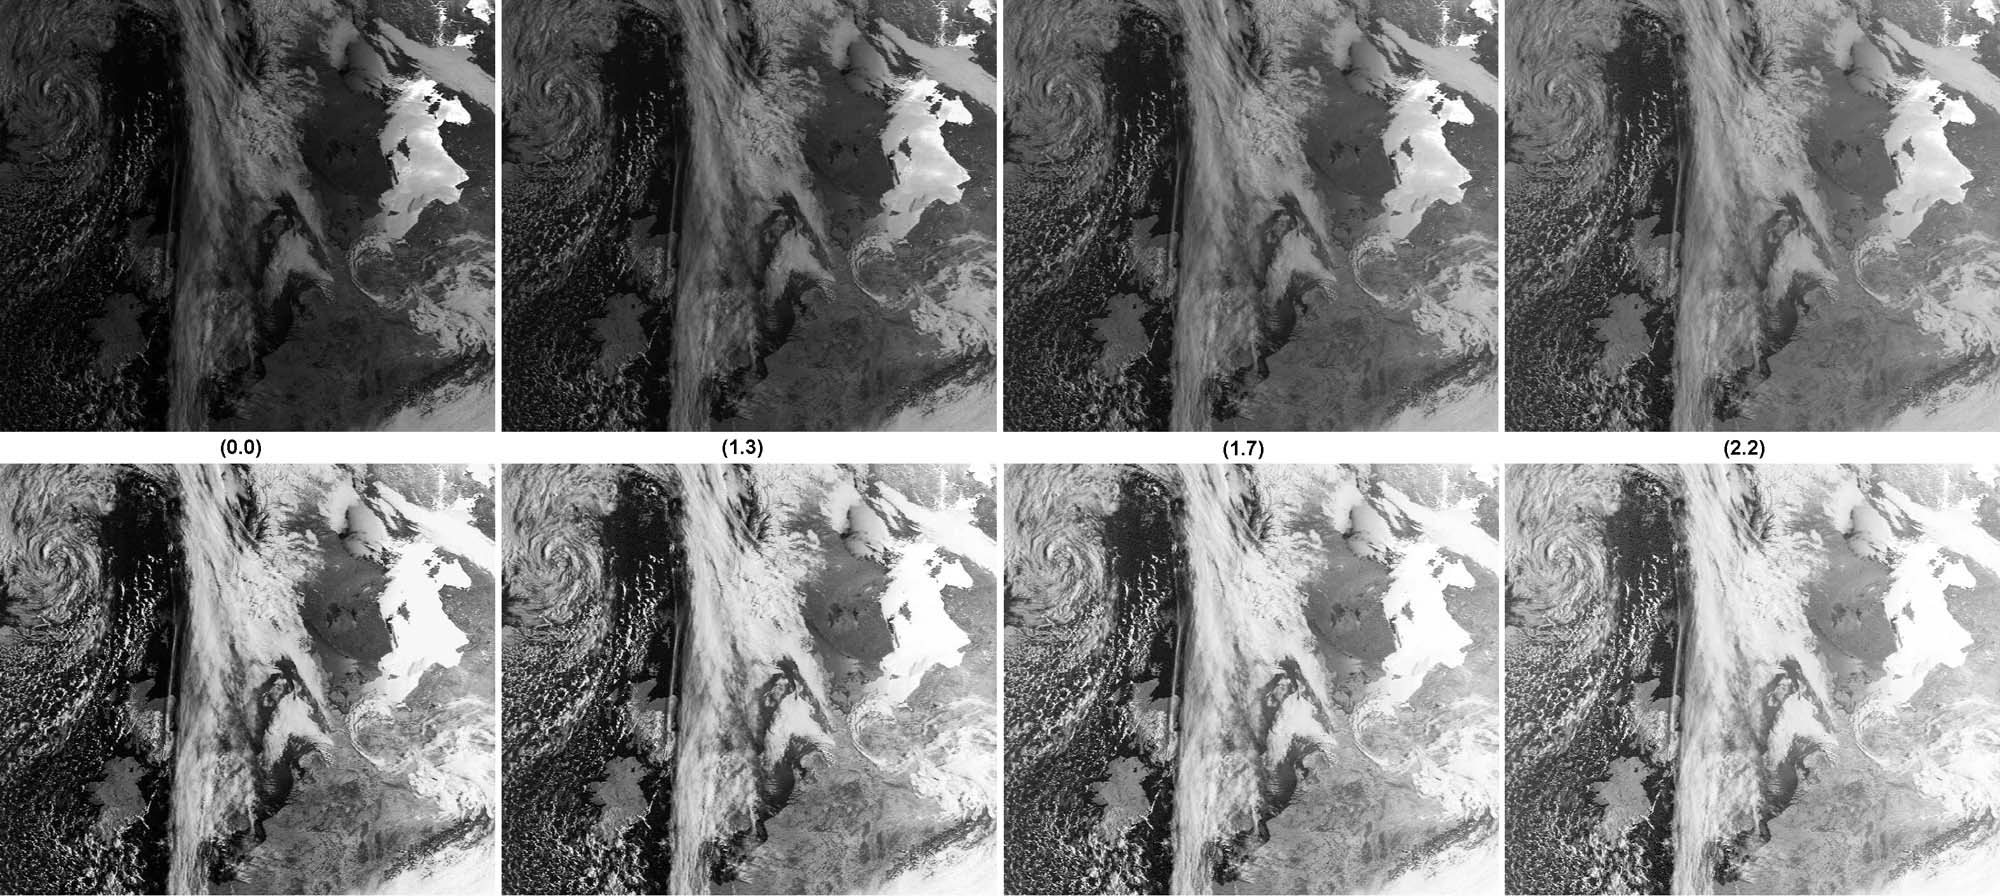
Histogram equalisation applied to an early morning NOAA 15 image (Click to enlarge)Why you should Register SatSignal
Use of the Illumination adjust feature of the registered version (Click to enlarge)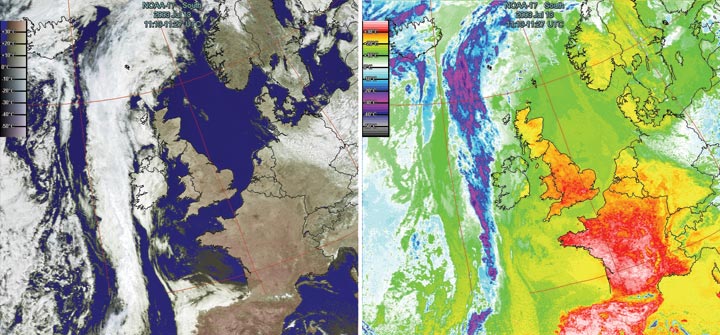
Registered features: Palettes, gridding, coutry outlines
times since December 1, 2005