
A Guide to Decoding APT Weather Satellite Images
Using a Sound-card and WXSat v 2.59 software
It is generally agreed that the simplest and least expensive option for processing NOAA APT data is the use ofChristian Bock's WXSat software, which uses the computer soundcard as its signal demodulator.
WXSat is capable of producing APT images of considerable clarity and detail from NOAA satellites, and thesoftware performs well under all versions of Windows from version 3.1 through XP.
Note that since WXSat is a 32-bit program, it may run on 32-bit Windows 7 and 8 systens, but will not run on 64-bit versions of these operating systems. It does not run on 32-bit Windows 10.
If you have an old Windows XP computer gathering dust, this would be absolutely ideal for reception using WXSAT.
Installing WXSat
Wxsat is supplied as a self-installing Windows archive file. Just run the WXSat259.EXE file, and it installs itself, complete with a desktop shortcut. Connect the audio output from your weather satellite receiver to the left channel of the sound-card, and you're ready to start. (In practice, any stereo audio lead with a 3.5 mm jack-plug at each end will be exactly what you require here).
Decoding NOAA Signals with WXSat
WXSat permits the user to produce images in real-time while the NOAA signal is being received. This image is saved in BMP bitmap format while the raw data can be archived as a wave (WAV) file. The program can also allowunattended capture of images and wave files, the latter being useful for future decoding and manipulation purposes.There are facilities to decode either NOAA channel individually, to decode both images side-by-side, and even to combine the two NOAA channels to produce a colour composite image (this last only during the summer half-year, when daylight levels are high).
Soundcard Capture
- Load WXSat and open the Parameters menu and select item No 0, NOAA. This will produce both visible and IR images side by side, like the illustration below.
- From the Recording menu, select 'Start at Subcarrier' --> 'Save Bitmap & Wave'.
- As soon as a NOAA APT signal is received by the soundcard, WXSat will start decoding it. An image will build up on the screen, one line at a time, and the data will simultaneously be saved as a WAV file.
- The WAV files are saved with filenames derived from the PC clock, in mmddhhmm.wav format (e.g. the file 07240854.wav was recorded starting at 08.45 am on July 24.

Figure 1 - The initial NOAA image
If all goes well, you should receive an image similar to the one in figure 1 above, which shows the two NOAA images side by side (infrared on left, visible on right).
Calibrating WXSat Parameters (using a saved NOAA WAV file)
Although you will probably obtain an image of sorts on your first attempt, it is unlikely to impress. It will probably be too dark, and lack a full range of tones. To produce the optimum result, you must make adjustments toWXSat's Parameter Window, illustrated below in figure 2.
This The easiest way to configure WXSat's parameters is by firstly saving the raw data from a NOAA transmission as a wave (WAV) file. This can be 'replayed' through WXSat many times, while parameters are adjusted until you have achieved the brightness and contrast that you desire.
Decode your WAV file so that the image shows in WXSat, then click the Calibrate --> Histogram menu.This illustrates graphically both the amplitude distribution and Luminance of the image.
First, examine the amplitude (upper) histogram, as shown in figure 3 below.
This should sit squarely between zero and 1.00 on its horizontal axis. If it does not, you must alter the 'BasicAmp' factor on the Parameter Window to make it do so. Herein lies the value of saving the WAV file. By changing this parameter, then decoding part of the WAV file again, the histogram may be adjusted until the best possible fit has been achieved.
This done, the luminance (lower) histogram (figure 3) must also be adjusted to fit along its horizontal axis in identical fashion, this time by making changes to the 'Ampl.1' value on the Parameter Window. With both histograms perfectly seated, you should obtain the best possible tonal values in your image when you decode the wave file.
After making changes to the default parameter set they must be saved in order to be used automatically with future NOAA images.
Do not click the 'OK' button at the foot of the Parameter Window (figure 2) at this time, or your changes will only apply to the current image.
Instead, click the File option on the Parameter Window's own menu bar and click 'Save Current Parameter Set' followed by 'OK' in the subsequent 'Save Paremeter Set' confirmation window.
You will next be asked to confirm 'Overwrite existing parameter set' in the 'Store Parameters' popup windowóclick 'OK' to confirm.
Each WAV files safely stored on your hard drive contains an accurate representation of the original audio signal from the NOAA satellite. This may be decoded time and again while you experiment with the variables in WXSat's Parameter Window.
To do this, open the File\Wave Input File menu and select a WAV file followed by the File\Parameters option to select your decoding mode. Select the NOAA_VIS button to decode the audio into a channel-2 visible light image, the NOAA_IR button for the channel-4 infrared image and NOAA_mIR for the channel-3 overnight IR image. All these modes produce full-resolution 1040 pixel-wide images. (The NOAA_mIR is only transmitted during the hours of darkness, but has poor contrast and does not provide very satisfying images).
The File\Start Processing option now initiates decoding. You will find that the image builds up much more rapidly than during live reception, and a percentage counter in the title-bar indicates progress. Decoding may be terminated at any time through the File-->Stop Processing option (or just pressing 'S' on the keyboard), and the image may be saved in BMP format via the Bitmap-->Save menu.
A word of warning - these images are not saved automatically in this manual mode. When you exit the program, the image is deleted from memory without saving.
Peak-to-peak amplitude must be set while receiving a 'live' NOAA signal.
Select Recording-->Test from the WXSat Menu Bar during reception of a 'live' NOAA signal to reveal an image of the signal's waveform, sandwiched between two grey horizontal lines (figure 4).
It is essential that the signal is as high as possible without breaching either of these lines. Although this adjustment can be achieved using the software supplied with your soundcard, WXSat is highly sensitive to multitasking, and frequently crashes if any other program operates simultaneously, especially on slower computers.
A far better option is to insert a variable potentiometer into the external audio feed connecting the weather satellite-receiver to the sound-card. This can be adjusted quickly and efficiently without affecting the operation of WXSat. Adjust the potentiometer until no peak in the display touches either the upper or lower grey line - this takes but a few seconds. Click Recording-->Stop followed by Recording-->Picture & Wave File to watch the image unfold.
When the satellite pass is complete, usually some 12 - 15 minutes later, select Recording-->Stopto complete the process and click the 'OK' box to save the WAV file.
To save the image as a BMP file, use the Bitmap-->Save as menu option.
For those of you who have to be at work for most of the day, automatic, unattended reception of satellite images is highly desirable, and WXSat is well able to meet this need through the Recording-->Start at Subcarrier menu options. There are several possibilities - you can choose to save either bitmap images, wave files, or both.
Use the Parameter menu to select a recording mode, say NOAA_VIS, make certain that your receiver is active on the correct channel, then make your selection from the Recording-->Start at Subcarrier Menu. Each time the satellite passes over your location, WXSat will become active on detecting the subcarrier frequency, and save files until the signal fades again. Filenames are based on the time indicated on the computer clock as each image is saved, in the form ddhhmmss.BMP etc. The process is elegant and works perfectly for all the NOAA satellites.
First, select the 'NO_VIS+IR' parameter set from the Decoding Parameters page. Note that the 'DualCh' box is already selected, an essential prerequisite for producing coloured images. Follow the procedure already described for optimising monochrome image quality. Note however that the upper histogram now shows two curves, a black one (channel-2 data: visible light) followed by a red one (channel-4 data: infrared).
This time, the entire histogram from the start of the black curve, to the conclusion of the red curve, must sit squarely between zero and 1.00 on the horizontal axis.
The lower histogram consists of two overlapping curves, the black channel-2 trace and a multicoloured trace representing channel-4. First, adjust 'Ampl.1' to fit the black curve between zero and 1.00 on the horizontal axis (exactly the same way as last time), then adjust 'Ampl.2' to make the coloured curve straddle the same range. Next decode a NOAA wave file and look particularly at the colour of the land. If the land is too blue, the coloured histogram must be slid along its axis in a leftwards direction using the 'Offset 2' option.
I find that the default value of -0.12 has to be decreased to between -0.20 and -0.30 to produce land showing pleasing green and brownish tones. Experiment till you find the value that seems most realistic, then note down the new parameters so that they can be saved future use.Provided output from the receiver into the sound-card is constant these settings should not require changing again.
Wxsat is by no means over-endowed with image editing features (load images into your paint program for this), but the two it possesses can be very useful indeed. Sometimes, the image may well be displayed with its edges in the centre of the screen (as if it had been slid sideways, and wrapped round the screen). WXSat can rectify this through its Exit-->Correct x menu item.
This acts on a completed image. Click on this menu option to convert the mouse-cursor into a vertical line. Next, move this cursor over the completed image to that part that should be lined up with the left-hand side of the monitor screen then click the left mouse-button. Almost instantly, the image will be correctly aligned and may now be saved in this form.
The second useful feature in the Edit menu is 'Substitute Line'. Not infrequently, a momentary burst of interference results in a single line of an image line being degraded. Using this item, it is the simplest of tasks to overwrite such an offending line by one of its immediate neighbours, to produce an 'invisible' repair. It's best first to use the 4x zoom to enlarge the image so that individual pixels are readily identifiable, before dragging the image with the right mouse button till the offending line shows on screen. Now click the Edit-->Substitute Line option to produce a small cross-hair cursor which should be clicked once on the offending line, then clicked on a neighbouring line. Replacement is instantaneous, and the repair cannot be detected once the image is restored to normal size.
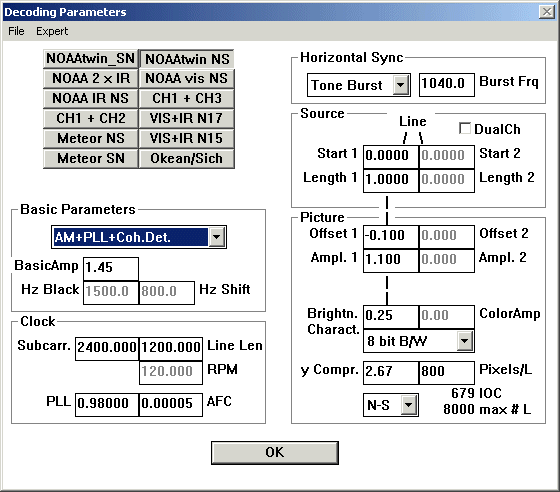
Figure 2 - The Parameter WindowSetting WXSat's Amplification Parameters
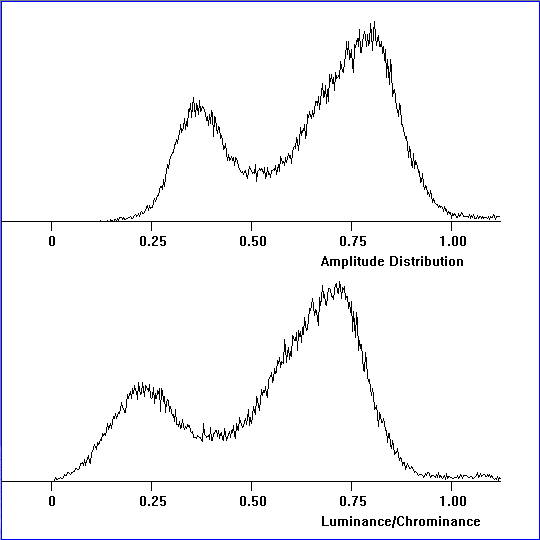
Figure 3 - Calibration HistogramsSaving the Default Parametes
Finally, click 'OK' at the foot of the Parameter Window to complete the process.
Processing Wave Files
Adjusting Peak Value
After decoding a WAV file, click Calibrate-->Values on the Menu Bar. This brings up a small pop-upwindow containing information on the image. The critical value is the 'Peak Values' item, which shows the peak-to-peak amplitude of the incoming signal. Values in the range +/- 0.9 give the best results. Values in excess of 1.0 produce clipping of the signal, giving the effect of an overexposed image with detail in the white tones 'washed out'.
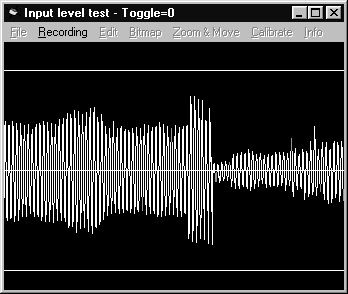
Figure 4 - A typical NOAA waveform
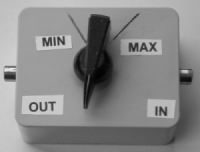
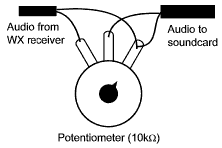
Figure 5 - A mounted in-line potentiometer and connection diagram Automatic Image Acquisition
Colour Composite Images
WXSat can produce attractive coloured images by using the IR channel data to impose a colour palette on the visible image (though generally this gives good results only between March and October,when daylight is strongest). This simple process does produce surprisingly attractive results once you have optimised the parameters, in particular, detailing layering in cloud structure by subtle changes in hue. Only the middle luminance values are modified by this process, as WXSat retains black and dark neutral shades for the lowest intensities (sea) and white and light greys for the highest intensities (cloud).
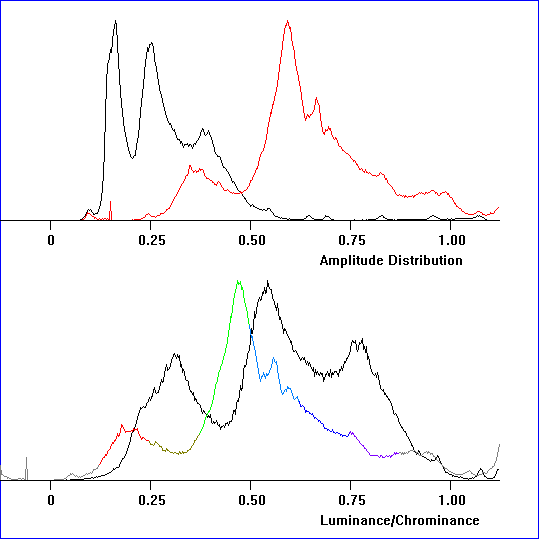
Figure 6 - Amplitude and Luminance histograms for a coloured image
Figure 7 - A typical coloured NOAA imageImage Editing
Summary
Wxsat must rate as the best entry-level software available for decoding weather satellite signals, particularly as the author offers it free for amateur use. In addition to producing monochrome APT images showing striking detail, the program boasts a host of features for optimising image quality, many not mentioned here. For the enthusiast who enjoys experimenting, WXSat is a dream come true. WXSat comes with a detailed 'Help' file, filled with hints andscreen-shots to assist you to get the best from the program.
times since March 13, 2004 